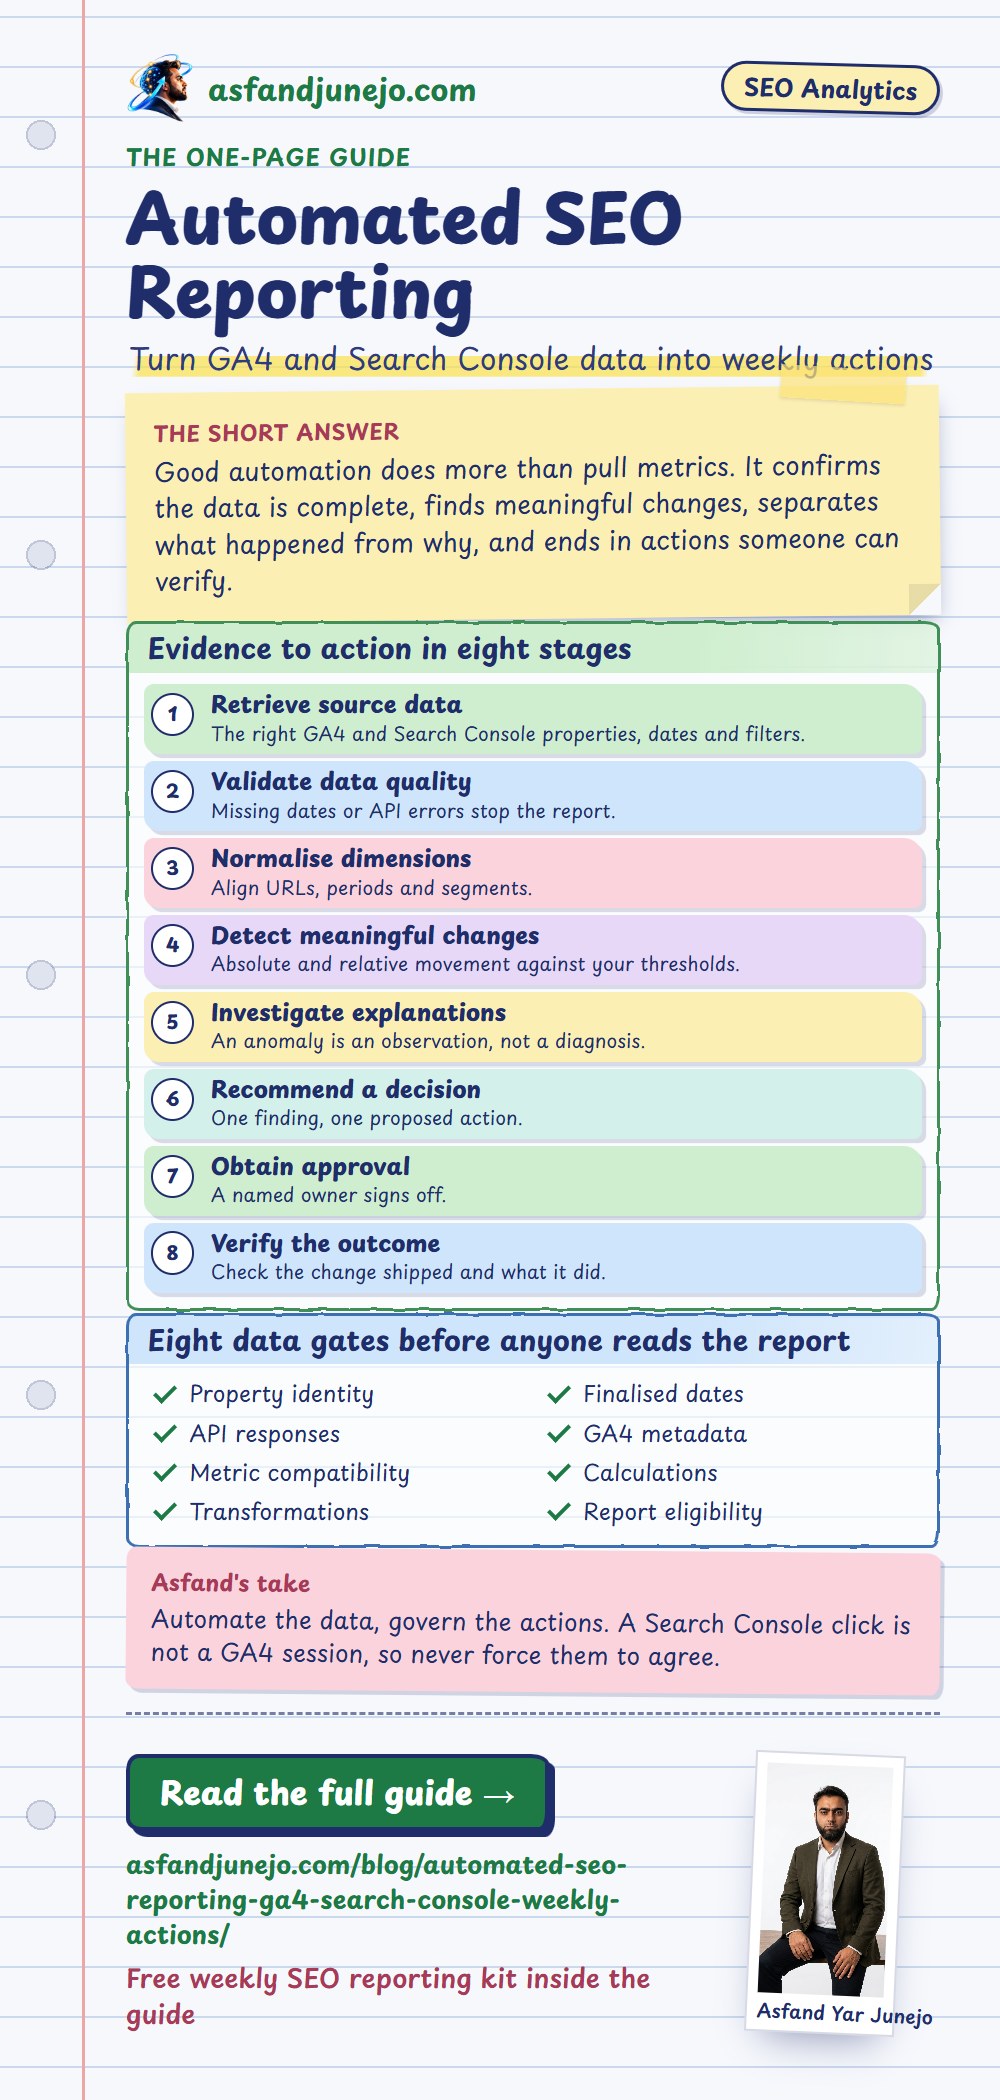
Automated SEO reporting is the process of collecting, validating, analyzing, and distributing search performance data on a recurring schedule. By combining Google Search Console (GSC) with Google Analytics 4 (GA4), SEO teams can monitor search visibility, website acquisition, engagement, and business interactions without having to rebuild reports manually every week. However, reliable automation must do more than retrieve metrics. It must establish whether the underlying data is complete, identify meaningful changes, distinguish observations from possible causes, and produce recommendations that can be independently verified.
Published · Last reviewed · By Asfand Yar Junejo, publisher asfandjunejo.com
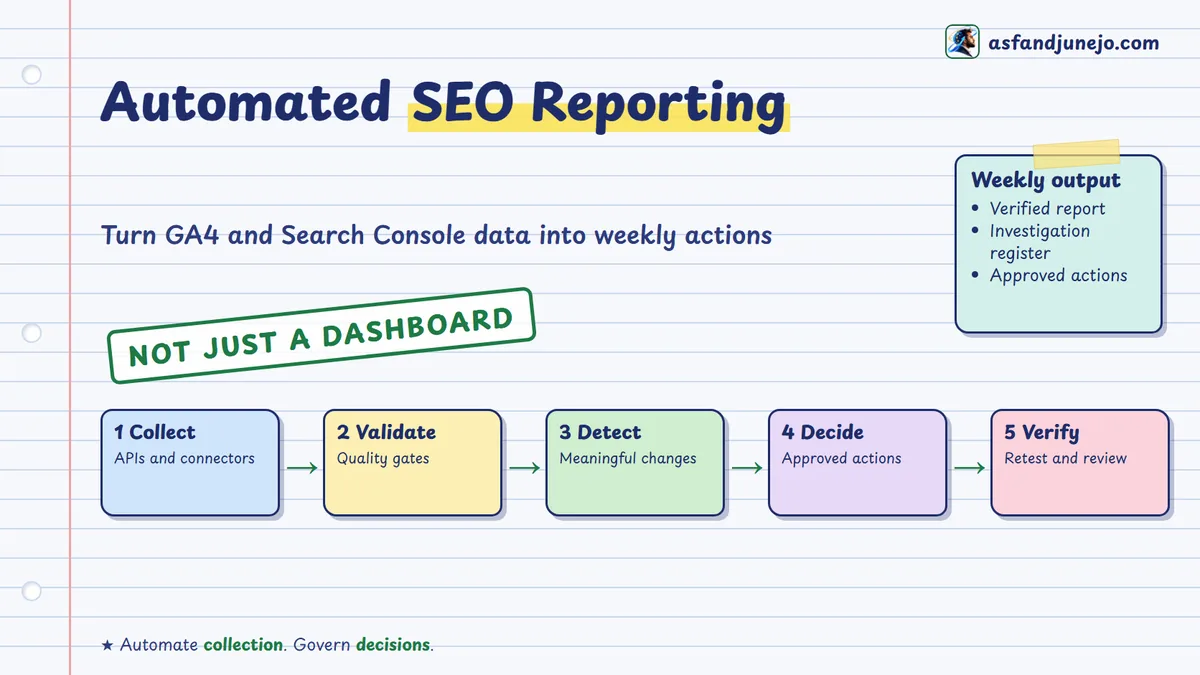
The central challenge is not access to information. Search Console already provides detailed insights into how websites appear in Google Search, while GA4 explains how visitors interact with website content. Google also provides official reporting connectors and APIs that support recurring analysis. The difficulty emerges when these measurements are combined without accounting for their different definitions, reporting periods, attribution rules, and processing limitations.
A report showing declining organic clicks may appear to indicate a ranking problem, even when impressions have fallen because fewer people are searching for the relevant topics. A discrepancy between Search Console clicks and GA4 sessions may appear to indicate broken tracking, even though the platforms measure fundamentally different events. An increase in organic traffic may also appear encouraging, even as the number of meaningful business interactions remains unchanged.
Automating these comparisons without appropriate verification can reproduce the same analytical mistakes every week, only faster and at a larger scale.
A more dependable approach treats SEO reporting as a controlled operational process in which measurements are collected, verified, interpreted, and translated into investigations or approved actions. Data collection can be automated, while consequential decisions remain subject to evidence, business context, and accountable human review.
This guide explains how to build that process, beginning with the measurement architecture and progressing through data-source integration, reporting-period normalization, quality assurance, and meaningful performance-change detection.
Why must weekly SEO reports lead to decisions?
Weekly SEO reporting should identify meaningful changes in search performance, explain what the available evidence supports, and establish which investigations or actions deserve attention. A report that only displays clicks, impressions, sessions, and rankings may accurately describe performance, but it does not necessarily help an organization decide what to investigate, prioritize, implement, or verify.
The distinction between a performance report and a decision-support system begins with the purpose of reporting itself.
An SEO dashboard answers questions about a website's state. It may show whether organic clicks increased, which landing pages attracted visitors, how engagement changed, or whether certain query groups declined. These measurements are useful because they establish what the reporting systems observed during a defined period.
However, operational decisions require additional context.
A declining metric does not automatically identify the cause of the decline. Nor does identifying the likely cause automatically establish which intervention should be prioritized over other available work. An organization may have limited development capacity, several competing content initiatives, and commercial landing pages with very different levels of importance.
Weekly reporting becomes more useful when it connects observed conditions to a structured investigation and prioritization process.
From descriptive reports to operational decisions
A report becomes a decision tool when it states what changed, how reliable the evidence is and what to investigate next.
Consider a report showing that organic sessions declined during the previous completed week.
The observation may be correct, but it is not yet a diagnosis.
The next questions should investigate whether the corresponding Search Console clicks changed, whether the decline is concentrated on specific landing pages, whether the relevant traffic-source classifications remained consistent, and whether the affected pages contribute meaningfully to business outcomes.
If Search Console clicks and GA4 sessions move in similar directions, the analyst may have stronger evidence of a broader acquisition movement. If they diverge, the investigation may need to examine tracking, source definitions, consent behavior, redirects, or reporting-period differences.
Neither outcome independently identifies a corrective action.
The purpose of the weekly workflow is to ensure that such observations lead to appropriate questions before an intervention is recommended.
What makes a report actionable?
An actionable SEO report should contain five distinct components.
| Component | Question answered | Required output |
|---|---|---|
| Observation | What changed? | Verified metric and period |
| Context | Where and how much did it change? | Affected URLs, segments, and historical baseline |
| Investigation | What could explain the change? | Supported and competing hypotheses |
| Decision | What should happen next? | Approved investigation or intervention |
| Verification | How will completion be established? | Acceptance criteria and retest evidence |
A report that skips the investigation may result in unnecessary content revisions, incorrect technical diagnoses, or changes that cannot be evaluated later.
For example, rewriting page titles because a sitewide CTR metric declined would be difficult to justify without examining whether the underlying query distribution, ranking positions, devices, or search-result presentation changed.
A more defensible report identifies the affected segments and recommends examining the corresponding search results before making an editorial change.
Automation does not establish analytical accuracy
Google’s official guide to (opens in a new tab)using Search Console and Google Analytics data for SEO (opens in a new tab) recommends examining the platforms together to understand how users discover a website and interact with it.
The same guidance emphasizes that the two sources measure different activities and that their totals should not be expected to match exactly.
This distinction becomes more important under automation because errors can be propagated repeatedly.
A system that selects incomplete reporting dates, mixes incompatible attribution scopes, or joins unrelated URL records can generate plausible-looking findings that are systematically wrong.
The value of automated reporting should therefore be evaluated through the quality of the decisions it supports, not simply through the number of reports delivered.
The operating principle
Run the same sequence every week: collect, validate, normalize, detect, investigate, decide, approve and verify.
A productive weekly reporting cycle should follow a repeatable sequence:
Collect → Validate → Compare → Investigate → Prioritize → Approve → Implement → Verify
Not every observed change needs to become an implementation task. Some findings warrant further investigation, while others are attributable to normal variability or known measurement changes.
An effective reporting process should be able to determine that no immediate remediation is warranted.
That restraint is part of analytical quality.
What do GA4 and Google Search Console each measure?
Google Search Console measures how a website performs in Google Search, while Google Analytics 4 measures recorded interactions with the website or application. Search Console provides impressions, clicks, click-through rate, and average position. GA4 provides information on sessions, engagement, events, and acquisition. Combining these sources offers a broader view of organic performance, but their metrics cannot be treated as interchangeable.
The distinction can be understood as the difference between search exposure and measurable activity after arrival.
Search Console primarily describes what happened within Google Search. GA4 describes behavior recorded through the website’s analytics implementation.
These systems overlap conceptually, but they do not record the same events.
What Google Search Console measures
Search Console’s Performance reporting provides information about how a property appears in Google’s search experiences.
Four metrics form the foundation of most weekly organic search reports.
| Metric | Definition | Analytical purpose |
|---|---|---|
| Clicks | Qualifying clicks from Google Search results | Search-driven acquisition |
| Impressions | Qualifying appearances in Search | Search exposure |
| CTR | Clicks divided by impressions | Observed click propensity |
| Average position | Google’s average position calculation for qualifying impressions | Search-result position context |
These metrics can be analyzed by dimensions such as date, page, query, country, device, and supported search types.
The (opens in a new tab)Search Analytics API (opens in a new tab) allows authorized applications to retrieve this information programmatically.
However, query-level reporting contains important limitations. Google does not guarantee that every possible query row will be exposed through the API.
A detailed query export should therefore not automatically be treated as the complete underlying search population.
What Google Analytics 4 measures
GA4 measures activity recorded through its analytics collection system.
For weekly SEO reporting, common metrics include sessions, engaged sessions, engagement rate, landing-page performance, and specific key events that represent meaningful website interactions.
GA4 also provides acquisition dimensions that describe the recorded sources of users and sessions.
A report examining Google-origin organic traffic should typically use an explicitly defined Google organic acquisition population, rather than assuming that the entire Organic Search channel is Google-only.
Google’s official SEO reporting guide demonstrates this approach using session source google and session medium organic.
Source: (opens in a new tab)Google Search Central, Using Search Console and Google Analytics Data for SEO (opens in a new tab).
Why Search Console clicks and GA4 sessions differ
A Search Console click represents a qualifying interaction within Google Search. A GA4 session represents a recorded period of interaction with the website or application.
One Google Search click does not necessarily create exactly one GA4 session.
Some visitors may leave before analytics collection occurs. Consent settings may prevent collection. A session may already be active, or redirects and attribution behavior may influence how activity is classified.
Other differences arise from reporting time zones, canonical URL handling, non-HTML resources, filtering, and bot treatment.
Google explicitly documents these discrepancies and recommends comparing the broader movement of the metrics rather than expecting identical totals.
A weekly system should therefore display clicks and sessions separately, with a diagnostic indicator when their trends diverge materially.
Comparing source definitions
Search Console and GA4 count different things, so compare their definitions before you compare their numbers.
| Dimension | Search Console | GA4 |
|---|---|---|
| Measurement environment | Google Search | Website or application |
| Search exposure | Impressions | Not an equivalent native session metric |
| Acquisition | Search clicks | Recorded sessions |
| Page identity | Search-reported page, often canonical URL | Tracked landing-page URL or path |
| Query information | Available, subject to privacy and reporting limits | Not a direct equivalent |
| Engagement | Not measured as GA4 engagement | Engaged sessions and engagement rate |
| Business activity | No direct GA4 event equivalent | Key events and transaction activity |
| Reporting time zone | Pacific Time | Property-configured time zone |
| Data availability | Search Console processing delay | GA4 processing and collection rules |
The value of using both platforms is not that they become one identical dataset. It is that each contributes a different view of the website’s performance.
Correct CTR calculations
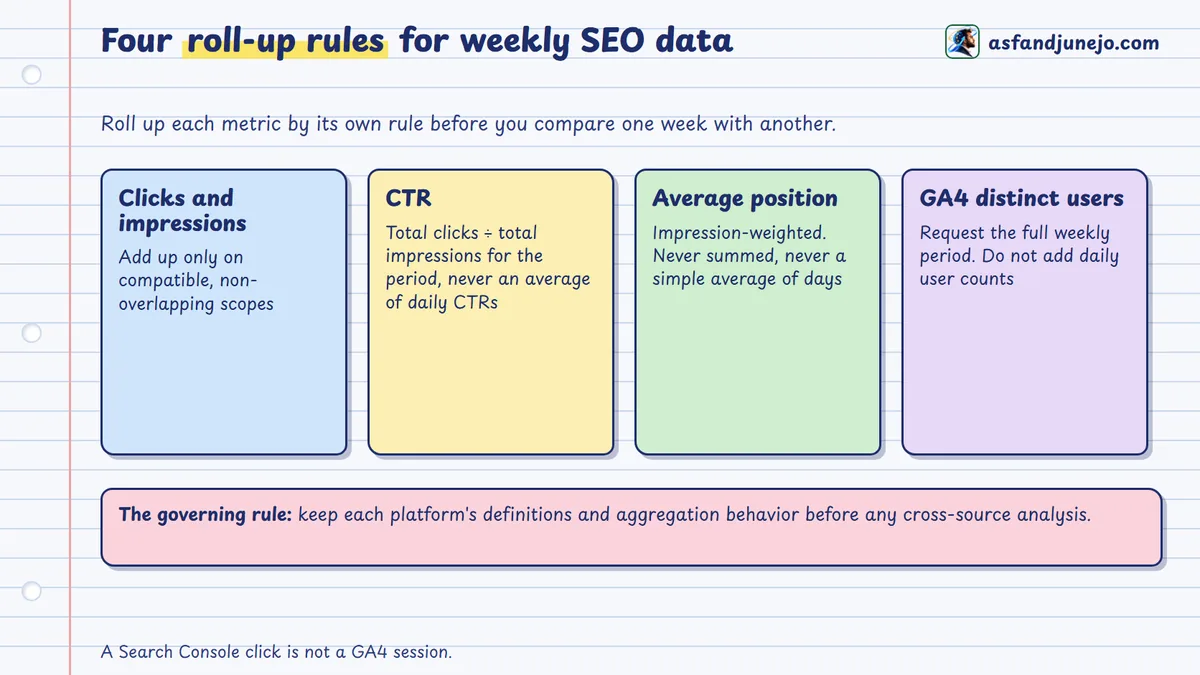
CTR is total clicks divided by total impressions for the period, never an average of daily CTR values.
Search Console CTR is calculated as:
CTR = Clicks ÷ Impressions × 100When producing a weekly CTR from daily records, use the total clicks divided by the total impressions for the relevant period.
Do not calculate an unweighted average of daily CTR values when the days have different impression volumes.
The same principle applies when aggregating country, device, or page segments.
Average position requires special handling
Google’s average position metric is calculated according to the positions and impressions associated with eligible Search results.
Position values should not be summed.
When a summary must be reconstructed from compatible segment-level measurements, the calculation must respect the appropriate impression weighting and Google’s aggregation rules.
A simple average of daily average positions can be misleading when impression volumes differ.
Sitewide position movement can also reflect a changing mixture of queries, countries, devices, and pages rather than a uniform ranking shift.
For that reason, a weekly position anomaly should generally initiate segment-level investigation before a conclusion is drawn.
Distinct users are not additive across days
GA4 reports may include users and other metrics that depend on deduplication across a reporting period.
Adding individual daily user counts can double-count users who were active on multiple days.
Google also documents approximate unique-count behavior in the GA4 Data API.
A weekly distinct-user figure should therefore be requested for the complete weekly reporting period, using an appropriate reporting method, rather than calculated by indiscriminately adding daily figures.
Source: (opens in a new tab)Google Analytics, Reporting Data Expectations (opens in a new tab).
The governing measurement rule is straightforward: preserve each platform’s definitions and aggregation behavior before attempting cross-source analysis.
What is the evidence-to-action SEO reporting framework?
The evidence-to-action reporting framework converts validated SEO measurements into investigated findings, approved tasks, and independently verified outcomes. It separates data retrieval from interpretation and keeps automated recommendations distinct from the authority to implement. The purpose is to make weekly reporting reproducible, reduce the number of unsupported diagnoses, and establish accountability for changes made in response to performance data.
A traditional reporting workflow often ends when a dashboard or PDF is delivered to stakeholders.
A governed reporting workflow continues until important findings have been investigated, decisions have been documented, and approved work has been verified.
This difference changes the system's design.
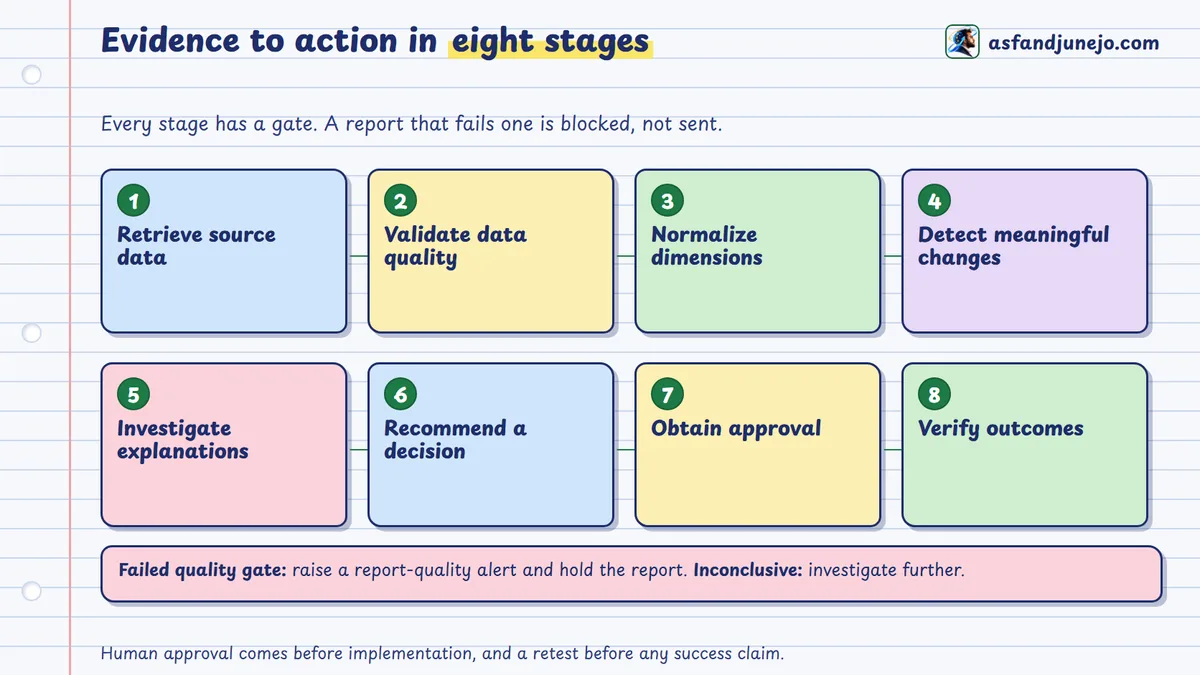
Stage 1: Retrieve source data
The reporting process begins with authenticated access to the correct GA4 and Search Console properties.
The selected metrics, dimensions, filters, search types, and reporting dates must be explicitly defined.
A valid API response does not yet establish that the retrieved values are appropriate for the reporting question.
Stage 2: Validate data quality
Before comparing performance, the system checks whether reporting dates are available, the expected records are present, and the relevant metrics are compatible.
Missing dates, incomplete reporting, API errors, unexpected source definitions, sampling metadata, or aggregation inconsistencies should be identified.
Material quality failures must prevent ordinary performance conclusions.
Stage 3: Normalize reporting dimensions
The system aligns reporting periods and establishes documented rules for representing URLs and comparable segments.
Normalization does not mean forcing unlike measurements to agree.
It means preserving source values while applying necessary transformations and justifications for the intended comparison.
Stage 4: Detect meaningful changes
Validated metrics are compared with appropriate historical baselines.
The system examines relative changes, absolute impact, historical variation, business relevance, and the consistency of affected segments.
A detected anomaly is an observation requiring assessment, not an established cause.
Stage 5: Investigate competing explanations
The analyst examines the affected pages, queries, traffic sources, and related evidence.
Possible explanations are evaluated against available observations.
Where the evidence cannot distinguish between competing causes, the result should remain a hypothesis or an unresolved investigation.
Stage 6: Recommend a decision
An investigated finding may lead to a proposed technical fix, an editorial review, a tracking audit, an experiment, or a decision not to intervene.
The recommendation should identify the evidence supporting it and the consequences of acting or not acting.
Stage 7: Obtain appropriate approval
Implementation authority should remain separate from reporting access.
A read-only reporting process may identify a canonical problem or recommend a content revision, but that does not authorize the reporting system to modify a production website.
The proposed task should have an accountable owner and explicit approval status.
Stage 8: Verify implementation and outcomes
Technical verification establishes whether the approved change was implemented as intended.
Outcome review examines subsequent performance under an appropriate observation period.
These are different forms of evidence.
Correcting a broken redirect can be verified technically without claiming that the correction caused all subsequent growth in organic traffic.
The evidence-to-action sequence
The flow runs from retrieval through a data-quality gate to human approval and verification; a failed gate raises a quality alert instead of a report.
Text version of the diagram
GA4 + Search Console
        |
        v
Authenticated Data Retrieval
        |
        v
Data Quality Gate
        |
        +---- Failed ---> Report Quality Alert
        |
        v
Metric and URL Reconciliation
        |
        v
Historical Comparison
        |
        v
Anomaly Detection
        |
        v
Evidence Investigation
        |
        +---- Inconclusive ---> Further Investigation
        |
        v
Proposed Action
        |
        v
Human Approval
        |
        v
Implementation
        |
        v
Technical Verification
        |
        v
Performance Outcome Review
This is a proposed operational framework, not an official Google reporting model.
Classification of reporting findings
Classify every finding by its evidence status so observations, hypotheses and proposals stay distinct.
| Classification | Meaning | Permitted output |
|---|---|---|
| Verified observation | Supported by retrieved, validated measurements | State the change |
| Investigative hypothesis | Plausible explanation requiring evidence | Recommend further checks |
| Supported diagnosis | Evidence sufficiently identifies a problem | Recommend an appropriate intervention |
| Proposed action | Task has been formulated | Submit for approval |
| Approved action | Responsible owner has authorized the work | Proceed through execution workflow |
| Verified implementation | Acceptance criteria were satisfied | Record technical completion |
| Outcome reviewed | Post-change evidence was evaluated | Report observed effects and limitations |
This classification prevents an AI-generated interpretation from becoming an implementation instruction merely because it appears convincing.
Which SEO KPIs belong in a weekly report?
A weekly SEO report should prioritize metrics that explain search exposure, acquisition, engagement, important landing-page changes, and defined business actions. The reporting set should remain small enough for decision-makers to interpret consistently, with supporting dimensions used for investigation rather than displayed indiscriminately. Every metric should have a documented source, definition, comparison period, and intended decision.
An effective report does not require every available metric from Search Console or GA4.
It requires enough information to recognize meaningful changes and determine where further analysis should begin.
The core weekly KPI set
Keep the weekly KPI set short, tie each metric to one source and define it once.
| KPI | Data source | What it measures | Primary use |
|---|---|---|---|
| Search impressions | GSC | Google Search exposure | Monitor demand and visibility movement |
| Search clicks | GSC | Clicks originating from qualifying Search results | Monitor search acquisition |
| Search CTR | GSC | Click propensity across reported impressions | Identify segments for SERP investigation |
| Average position | GSC | Reported Search-result position context | Investigate comparable ranking segments |
| Google organic sessions | GA4 | Recorded website sessions attributed to Google organic | Monitor site acquisition |
| Engaged sessions | GA4 | Sessions meeting GA4 engagement criteria | Assess observed interaction |
| Engagement rate | GA4 | Percentage of engaged sessions | Investigate changing engagement |
| Defined key events | GA4 | Recorded important website actions | Monitor business interactions |
| Landing-page contribution | GSC and GA4 | Page-level search and site activity | Identify important affected pages |
| Data-quality status | Reporting workflow | Reliability of retrieved records | Determine reporting eligibility |
The initial report should show current-period values, comparison-period values, absolute changes, and appropriately calculated relative changes.
Not every movement requires a performance judgment.
Search visibility metrics
Clicks and impressions should generally appear together because their relationship helps identify the nature of a change in search performance.
If impressions decline while CTR remains relatively stable, the next investigation may examine search demand, visibility across query groups, indexing, or changes in page participation.
If impressions remain stable but clicks decline, the investigation may focus more heavily on click propensity, query composition, ranking distributions, and search-result presentation.
Neither pattern establishes a cause on its own.
Website acquisition and engagement
GA4 sessions provide evidence of measurable website activity, while engagement metrics provide additional behavioral context.
A decline in engagement rate may justify reviewing landing-page relevance, tracking behavior, or changes in the visitor population.
However, the report should not automatically describe every decrease in engagement rate as declining content quality.
A change in acquisition mix or the events used to define engagement may produce similar results.
Commercial outcomes
Where lead generation is relevant, the report should identify specific key events such as successfully submitted inquiry forms or other approved commercial interactions.
Those events should be independently validated.
An automatically triggered event is not necessarily a unique qualified lead.
When the organization requires lead qualification or pipeline reporting, a CRM may be necessary to establish the underlying business stage reliably.
Diagnostic dimensions
The weekly executive summary should remain focused, but the supporting analysis should retain relevant dimensions.
| Dimension | Diagnostic purpose |
|---|---|
| Landing page | Identify affected content |
| Search query | Investigate available query-level movements |
| Country | Detect geographic concentration |
| Device | Identify device-specific patterns |
| Date | Analyze timing and stability |
| Search type | Separate Web and other supported Search surfaces |
| Session source/medium | Validate GA4 acquisition populations |
| Canonical URL | Investigate page-identity differences |
| Business page category | Connect changes with commercial importance |
A mature reporting system can use these dimensions to generate focused investigations while keeping the primary dashboard readable.
Include reporting-quality indicators
Every weekly report should identify whether the comparison periods are complete, whether source queries succeeded, and whether important quality warnings exist.
A performance summary without a quality status can create false confidence.
Where the evidence is incomplete, the dashboard should communicate that limitation directly rather than presenting the available figures as a normal, fully verified reporting cycle.
How do you connect Google Analytics 4 and Google Search Console?
GA4 and Google Search Console can be integrated into a shared reporting environment via Google’s reporting connectors or accessed independently via their official APIs. A dashboard-based connection is suitable for routine visualization and scheduled delivery, while API-based retrieval provides greater control over validation, historical storage, and automated analysis. The appropriate implementation depends on reporting complexity and governance requirements.
The two most practical paths are visual and programmatic reporting implementations.
Both require accurate property selection and appropriately restricted access.
Option A: Connect both sources through Google Data Studio
Google’s reporting product, historically known as Looker Studio and documented in current Google Cloud materials as Data Studio, supports connections to both Search Console and GA4.
The setup begins by creating a report or opening an approved reporting template.
Connect the Search Console property, choose the relevant Search type, and select the appropriate aggregation method.
The Search Console connector offers two principal aggregation modes:
- Site Impression: Appropriate for reporting in which impressions and other supported metrics are aggregated at the property level.
- URL Impression: Appropriate for page-oriented reporting and relevant URL dimensions.
Google explains that one Search Console connector data source cannot use both aggregation methods simultaneously. When both views are needed, create separate data sources and clearly identify them.
Source: (opens in a new tab)Google Cloud, Connect to Search Console (opens in a new tab).
Then connect the corresponding GA4 property.
Set up the primary dashboard
A first dashboard shows Search Console performance, GA4 organic engagement, key landing pages and a visible reporting period with source-quality status.
A practical initial report should contain:
- GSC clicks, impressions, CTR, and supported position measurements.
- GA4 sessions from the intended Google organic population.
- Engagement rate and relevant key events.
- Search and acquisition trends over the selected period.
- Important landing pages.
- Country and device filters where applicable.
- A clearly visible reporting period and source-quality status.
Google’s official (opens in a new tab)combined reporting guide (opens in a new tab) provides a reporting template and explains how the two platforms can be displayed together.
The dashboard should preserve each data source’s definitions rather than silently blending unrelated metrics.
Option B: Connect through the official APIs
A programmatic workflow uses the Search Console Search Analytics API and the GA4 Data API.
The basic architecture is:
Text version of the diagram
Google Cloud Project
        |
        +---- Search Console API
        |          |
        |          v
        |     GSC Extract
        |
        +---- GA4 Data API
                   |
                   v
              GA4 Extract
Both Extracts
        |
        v
Validation and Storage
        |
        v
Weekly Reporting Logic
For read-only analysis, credentials should be restricted to the necessary reporting operations.
The Search Console API supports the web admins. read-only OAuth scope.
GA4 also provides read-only reporting authorization through its supported authentication methods.
A Google Cloud project used to enable an API does not automatically grant the associated identity access to every GA4 or Search Console property.
Property permissions must be configured separately.
Identify the correct properties
A Google Cloud project ID, a GA4 property ID, and a Search Console property identifier are distinct values.
For example:
| Identifier | Illustrative format |
|---|---|
| Google Cloud project | seo-reporting-project |
| GA4 property ID | 123456789 |
| GA4 API reference | properties/123456789 |
| Search Console Domain property | sc-domain:example.com |
| Search Console URL-prefix property | https://www.example.com/ |
These values are illustrative, not real credentials or audited properties.
The correct identifier must be used for every request.
A Domain property may cover multiple hostnames, whereas a specific GA4 property may have a different collection scope.
That difference becomes relevant when reconciling page-level information.
Protect access before scheduling
A production workflow should avoid embedding long-lived secrets in source files, reports, or public examples.
Use secure credential management, appropriate OAuth scopes, and access restricted to the intended properties.
Reporting accounts should not be granted website modification permissions solely to retrieve data via an automated report.
Where service accounts are used, apply the relevant Google Cloud and property-level permissions without unnecessary administrative privileges.
Connecting the platforms should be treated as the beginning of the reporting configuration, not proof that the measurements have been reconciled.
How do you automate SEO data collection and report delivery?
Automated SEO reporting can be implemented by scheduling dashboard delivery or by running recurring API queries that retrieve, validate, and store source measurements. Dashboard scheduling is the simpler approach, whereas an API pipeline supports more robust data-quality checks and structured investigation workflows. Neither approach automatically establishes the accuracy of the resulting recommendations.
The distinction between automated delivery and automated analytical governance should remain explicit.
Method 1: Schedule a reporting dashboard
After configuring a Data Studio report, review its filters, date ranges, and source connections.
Google supports scheduled PDF delivery to authorized recipients through its reporting interface.
The current documentation describes how to configure the report’s schedule, recipients, reporting pages, repeat frequency, and relevant filter settings.
Source: (opens in a new tab)Google Cloud, Schedule Automatic Report Delivery (opens in a new tab).
This approach is suitable for teams that want predictable recurring reporting without maintaining an extensive custom data pipeline.
However, scheduled delivery alone does not necessarily check whether the newest Search Console dates are finalized or whether an anomaly represents a genuine SEO issue.
If the reporting system requires strict data-quality controls, those controls must be designed and implemented separately.
Method 2: Query Search Console programmatically
The Search Analytics API supports date ranges, dimensions, search types, filters, and pagination.
A basic request template for daily Google Web Search measurements is:
{
  "startDate": "YYYY-MM-DD",
  "endDate": "YYYY-MM-DD",
  "dimensions": ["date"],
  "type": "web",
  "dataState": "final",
  "rowLimit": 25000
}
The dates must be replaced with a valid explicit range.
The final data state instructs the API to return finalized data rather than include the most recent, potentially incomplete reporting.
Google notes that missing dates are omitted from date-grouped responses. Therefore, a data-availability check should be performed before generating the weekly analysis.
For more detailed queries, the API supports startRow pagination, with a maximum of 25,000 rows per request.
However, the API does not guarantee that every underlying query row is returned. Google documents a limit of up to 50,000 rows per day and per search type, along with additional privacy and aggregation restrictions.
Pagination retrieves more of the available data. It does not recover rows that Google does not expose.
Source: (opens in a new tab)Google Search Console, Getting Your Performance Data (opens in a new tab).
Method 3: Retrieve GA4 reporting data
The GA4 Data API supports structured reporting requests through methods such as runReport.
An illustrative request to examine sessions and engagement by source and date is:
{
  "dateRanges": [
    {
      "startDate": "YYYY-MM-DD",
      "endDate": "YYYY-MM-DD"
    }
  ],
  "dimensions": [
    {"name": "date"},
    {"name": "sessionSourceMedium"}
  ],
  "metrics": [
    {"name": "sessions"},
    {"name": "engagedSessions"},
    {"name": "engagementRate"}
  ]
}
This example demonstrates the request structure and does not represent an executed query.
A production report focused on Google organic sessions should apply and verify the appropriate acquisition filter.
GA4 also supports additional dimensions, metrics, and report-level controls, but compatibility must be verified before combining them into a single request.
Source: (opens in a new tab)Google Analytics Data API, Create a Report (opens in a new tab).
Preserve the original response
A robust pipeline should retain enough information to reproduce each important report.
At minimum, record the source system, property, query parameters, retrieval timestamp, response status, reporting dates, relevant metadata, and transformed output.
Where data is stored for historical analysis, retain the distinction between raw responses and normalized reporting tables.
This makes it possible to investigate why a metric changed after a reporting rule, API response, or transformation was modified.
Schedule the workflow safely
A recurring process can be orchestrated through approved scheduling infrastructure, such as a managed job scheduler, an authorized automation platform, or a controlled data pipeline.
The implementation should support:
- Explicit property selection.
- Secure authentication.
- Repeatable date selection.
- API quota handling.
- Bounded retries.
- Duplicate-run prevention.
- Source validation.
- Failure notification.
- A stable reporting output.
A failed source query should not silently generate a normal-looking report using stale or incomplete information.
Do not assume every Search Console feature is available through the same API
Google introduced dedicated Generative AI Performance reports in 2026 for supported AI Overviews and AI Mode exposure.
Those reports provide a separate interface for observing generative AI impressions.
However, the ordinary Search Analytics API documentation does not establish a dedicated equivalent API reporting mode for those new figures.
An automated SEO article should therefore avoid promising unsupported programmatic extraction of the separate generative AI report.
If that reporting is included, its actual acquisition method and automation status should be identified.
Source: (opens in a new tab)Google Search Central, Introducing Generative AI Performance Reports (opens in a new tab).
How do you normalize URLs, dates and reporting metrics?
GA4 and Search Console data should be normalized through explicit rules for reporting periods, URL identity, source filters, and metric aggregation. Normalization makes records easier to compare while preserving their original meanings. It must not force Search Console clicks to equal GA4 sessions or create unsupported relationships between search queries and business events.
The most consequential reconciliation problems usually arise from three sources: different reporting dates, different page identifiers, and different definitions of the measured activity.
Normalize reporting dates first
Google Search Console uses Pacific Time for Search Analytics reporting dates.
GA4 uses the reporting time zone configured for the property.
Therefore, requesting the same calendar date range from both systems does not necessarily retrieve identical absolute time intervals.
For routine weekly SEO analysis, the practical approach is to use clearly stated, matching calendar-date boundaries while documenting the remaining time-zone limitation.
For investigations requiring exact temporal alignment, additional time-granular data and suitable processing may be necessary.
Use finalized reporting windows
Use a seven-day window that ends on the latest finalized Search Console date, D, and compare it with the seven days before.
Let D be the latest Search Console date that has been verified as finalized and available for the relevant reporting scope.
Define:
- Current week: D minus six days through D, inclusive.
- Comparison week: D minus 13 days through D minus seven days, inclusive.
Both periods contain seven days and the same number of each weekday.
This approach is preferable to assuming that the seven calendar days immediately preceding report generation are finalized.
However, the actual data-availability check must confirm that the required dates are present.
An empty date-grouped result does not necessarily represent a measured day with zero activity. It may indicate that no data was returned for that date.
If the report cannot establish a complete comparable period, it should identify the limitation before publishing performance conclusions.
Normalize URLs without discarding evidence
Search Console may report a canonical page using a full URL.
GA4 may report a landing page using a path or path-and-query-string representation.
The website may also have redirects, trailing-slash variations, multiple subdomains, protocol variations, or different analytics streams.
Consider these illustrative identifiers:
Search Console page
https://www.example.com/services/seo/
GA4 landing-page path
/services/seo/
The values may refer to the same content, but that relationship requires the correct hostname and property context.
A normalization system should not automatically merge every matching path across different hosts.
The original values should be retained and transformed values stored separately.
Recommended URL mapping fields
Keep the original URL values beside the approved comparison URL, and flag ambiguous mappings for review.
| Field | Purpose |
|---|---|
| GSC reported URL | Preserve original Search Console identifier |
| GA4 hostname | Identify measured host |
| GA4 landing path | Preserve reported landing-page dimension |
| Final destination | Document known redirect result |
| Declared canonical | Record publisher’s preferred URL |
| Google-selected canonical | Record when available |
| Normalized comparison URL | Approved analytical mapping |
| Match status | Exact, mapped, ambiguous, or unmatched |
| Evidence | Source supporting the mapping |
Where a URL relationship is ambiguous, the record should remain unmatched until sufficient evidence is available.
Normalize acquisition scope
GA4’s Organic Search channel is not necessarily identical to Google-origin organic traffic.
For a closer comparison with Search Console Web Search data, use the intended Google organic source and medium population.
Verify the acquisition scope and filters rather than assuming that channel labels alone establish a comparable dataset.
Country and device filters should also be aligned where a segmented comparison is intended.
Care is needed because the available dimension values and definitions may differ between the platforms.
Respect metric aggregation
Additive measurements such as clicks and impressions can generally be summed across compatible, nonoverlapping dimensions.
However, averaging percentages or position measurements without appropriate weighting can yield invalid results.
For example:
Weekly CTR = Total weekly clicks ÷ Total weekly impressionsFor GA4, the correct treatment of sessions, user counts, engagement, and key events depends on the metric definitions and reporting grain.
Google documents approximate distinct-count behavior, sampling, and thresholding in its guidance on (opens in a new tab)reporting expectations (opens in a new tab).
The reporting transformation should be designed around those definitions.
Do not invent query-to-conversion attribution
Search Console provides query-level search measurements. GA4 provides website activity and key-event measurements.
A query that generates impressions or clicks does not automatically have a direct, observable relationship to a particular GA4 conversion.
Combining page-level trends can help identify useful areas for investigation, but it does not establish that a specific query generated a specific lead.
The system should distinguish supported page-level comparisons from unsupported user-level or query-to-conversion attribution.
How do you validate SEO data before generating weekly reports?
A reliable automated SEO report should pass explicit data-quality checks before its performance findings are distributed. Those checks should verify property identity, finalized reporting dates, required fields, aggregation compatibility, API completeness, and calculation integrity. A failure affecting an important measurement should produce a reporting-quality alert rather than an ordinary performance verdict.
Data validation is not a decorative final step.
It determines whether the observations being analyzed can support the conclusions produced by the reporting system.
A sophisticated anomaly detector cannot compensate for incorrect source data.
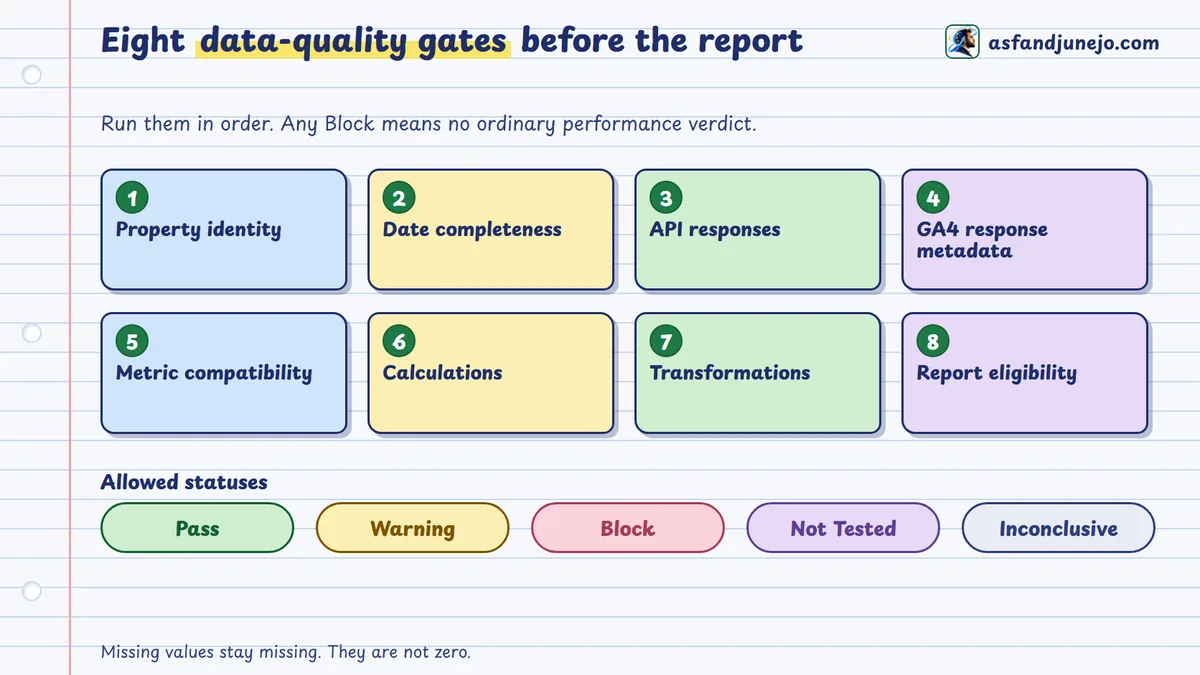
Gate 1: Verify property identity
Confirm that the selected GA4 property and Search Console property are the intended reporting sources.
The workflow should record both identifiers.
A valid Google Cloud API request can still retrieve the wrong authorized property if the configuration is incorrect.
Gate 2: Verify date completeness
Check that the required Search Console dates are present and finalized.
Verify the corresponding GA4 reporting period independently.
Do not interpret incomplete recent data as an ordinary performance decline.
A scheduled report may use the latest fully verified window rather than the most recent calendar week.
Gate 3: Validate API responses
Confirm every API request succeeded and returned the expected records before you use the data.
Inspect request success, returned records, pagination, and relevant API errors.
A successful HTTP response does not establish that every expected dimension or row is available.
Search Console’s API explicitly warns that detailed query results may omit rows.
A missing query should not be interpreted as proof that the query generated no activity.
Gate 4: Inspect GA4 response metadata
The GA4 Data API can return important metadata describing the reliability or limitations of a report.
Relevant fields include:
- samplingMetadatas
- subjectToThresholding
- dataLossFromOtherRow
- timeZone
- schemaRestrictionResponse
The presence of sampling, thresholding, or aggregated (other) values may materially affect the interpretation of certain reports.
The appropriate response depends on the reporting question.
A high-level directional summary may remain useful with qualified limitations. At the same time, a granular page-level or segment-level diagnosis may require a less restrictive query or an alternative data source.
Source: (opens in a new tab)GA4 Data API Response Metadata (opens in a new tab).
Gate 5: Validate metric compatibility
Check whether requested metrics and dimensions are supported together.
Adding a dimension can change the reported population when not every event has an associated dimension value.
Google explicitly identifies this as a potential cause of differences between otherwise related GA4 reports.
The system should not automatically classify such differences as changes in SEO performance.
Gate 6: Validate calculations
Recalculate important percentages and changes from the retrieved source values.
Common errors include averaging daily CTR percentages, summing distinct-user counts, treating missing data as zero, and comparing metrics calculated at different grains.
Every material calculated KPI should have a reproducible formula.
Gate 7: Validate transformations
Check whether the URL normalization and mapping process produced unexpected duplicates, unmapped records, or many-to-many joins.
A seemingly small mapping problem can substantially distort page-level reporting when an important URL appears under several variants.
The system should preserve raw source values so the transformation can be audited.
Gate 8: Determine report eligibility
Each gate should return an explicit result.
| Status | Meaning | Reporting behavior |
|---|---|---|
| Pass | Required check satisfied | Continue |
| Warning | Limitation exists but may not invalidate the intended summary | Continue with disclosure |
| Block | Material requirement failed | Suppress ordinary findings |
| Not Tested | Verification not performed | Do not claim validation |
| Inconclusive | Evidence insufficient | Escalate or narrow the analysis |
A blocked report should not simply disappear.
It should generate a diagnostic record that identifies the failed source, affected period, observed problem, and the next required investigation.
Example pre-report validation register
Give every pre-report check an evidence requirement and a default status of Not Tested.
| Check | Evidence required | Default status |
|---|---|---|
| GA4 property identity | Authorized property reference | Not Tested |
| GSC property identity | Authorized property reference | Not Tested |
| Finalized dates | GSC date availability result | Not Tested |
| GA4 freshness | Reporting period and relevant metadata | Not Tested |
| API completeness | Request, response, pagination | Not Tested |
| Source filters | Verified source and medium rules | Not Tested |
| Metric calculations | Reproducible formula output | Not Tested |
| URL mapping | Mapping exception report | Not Tested |
| Reporting approval | Completed quality-gate record | Not Tested |
This table is a validation template, not the result of a live data audit.
The goal is to ensure that every published weekly report has a known evidentiary status.
Data quality is covered. The free Weekly SEO Reporting and Actions Workbook gives you the data contract, QA release gate, anomaly review and action register as ready-to-fill tabs.
How do you detect meaningful SEO performance changes automatically?
Automated SEO anomaly detection should identify deviations that are sufficiently large, reliable, and important to warrant investigation. A useful detection model evaluates absolute and relative changes against historical behavior, assesses the trustworthiness of the source data, and considers the business significance of the affected pages. A detected anomaly is not a verified diagnosis.
Simple thresholds can help identify candidate changes, but they should not govern every website indiscriminately.
A 20% decline can be insignificant on a page with very little activity. A smaller percentage decline can matter substantially when it affects a commercially important landing page.
The reporting process must therefore evaluate more than just the percentage.
Begin with absolute and relative changes
Start with the absolute change and the relative change, together with the baseline they compare.
For an additive metric:
Absolute change = Current period − Previous period
Relative change (%) = (Current period − Previous period) ÷ Previous period × 100The calculation should explicitly identify the current and comparison periods.
When the previous value is zero, a conventional relative percentage change is undefined.
The system should not invent a finite growth rate in that case.
For rates such as CTR and engagement rate, distinguish percentage-point changes from relative percentage changes.
Establish a historical baseline
A one-week comparison is useful, but normal variation, holidays, events, temporary campaigns, or changes in search behavior can distort it.
A stronger system also considers previous weeks and, where relevant, longer historical patterns.
The baseline should use periods that are sufficiently comparable for the question being investigated.
A website with strong seasonal activity may require a different baseline from a website with relatively stable demand.
The system should also record major website releases, track changes, and note known market events that could affect interpretation.
Consider business importance
An anomaly detector should not prioritize findings solely by percentage change.
Relevant business factors may include:
- The landing page’s commercial importance.
- Historical contribution to qualified leads.
- Strategic importance of the affected content.
- Absolute click or session movement.
- Breadth of the affected URL group.
- Consistency of the movement across segments.
- Confidence in the underlying measurements.
A high-value service page experiencing a substantial absolute decline may warrant attention before a low-volume article with a larger relative percentage movement.
Classify the type of anomaly
Classify each anomaly by type before you decide how to investigate it.
| Detected condition | What is observed | Required next investigation |
|---|---|---|
| Click decline | Fewer GSC clicks | Examine impressions, CTR, queries and pages |
| Impression decline | Reduced Search exposure | Investigate demand, indexation and query mix |
| CTR decline | Lower clicks relative to impressions | Examine comparable positions and SERP conditions |
| Position movement | Changed average position | Analyze query- and page-level distribution |
| GA4 session decline | Fewer measured sessions | Compare relevant GSC acquisition trends |
| Engagement decline | Lower observed engagement | Review visitor mix, page intent, and tracking |
| Key-event decline | Fewer recorded important interactions | Validate events and relevant user flows |
| Reporting coverage change | Missing expected records | Investigate pipeline and data completeness |
These conditions represent entry points for investigation.
They are not automatic proof that a content, technical, or ranking problem exists.
Avoid universal thresholds
A rule such as “alert when clicks fall by 20%” may be useful as a preliminary screening condition.
However, a universal threshold ignores baseline volume, expected variation, strategic importance, and the possibility of incomplete data.
An advanced system may use historical distributions, appropriate statistical methods, and configurable business-impact rules to prioritize candidate anomalies.
The calculation method must be documented and validated rather than described as intelligent simply because it is automated.
Examine contradictions before producing tasks
Suppose the system identifies a decline in impressions for a group of pages.
Before recommending an intervention, it should check whether the corresponding query groups declined, whether the reporting period is complete, whether the affected pages remain indexed, and whether the change is confined to a device or country.
If query demand appears to have declined while average positions remain relatively stable, the evidence may support a demand-related hypothesis.
If indexed page counts, canonical behavior, or crawl access changed, a technical explanation may deserve investigation.
If neither hypothesis is sufficiently supported, the appropriate action is to proceed with further diagnosis.
The system should not invent certainty to satisfy a requirement that every alert produce a fix.
Recommended anomaly output
Each detected movement should produce a concise investigation record.
| Field | Required content |
|---|---|
| Finding ID | Unique identifier |
| Metric | Exact GA4 or GSC metric |
| Source | Reporting system and property |
| Reporting period | Explicit current and comparison dates |
| Change | Absolute and relative movement |
| Affected segment | URL, country, device or query group |
| Historical context | Baseline and variability |
| Data-quality status | Pass, warning or block |
| Business importance | Documented prioritization context |
| Possible explanations | Hypotheses, not assumed facts |
| Contradictory evidence | Relevant inconsistent observations |
| Recommended next step | Investigation or supported intervention |
| Confidence | Evidence-based classification |
A useful automated system can distinguish between a finding that deserves immediate human review and one that should remain under observation.
The objective is to reduce unnecessary investigations while ensuring important changes are not ignored.
What happens after anomaly detection?
Once a potential issue has passed the relevant quality and significance checks, it should enter a controlled investigation and decision workflow.
The next stage determines whether the evidence supports an actionable diagnosis, whether additional data is required, and whether a proposed intervention should be assigned to a content, technical SEO, analytics, or development owner.
Implementation approval should remain separate from anomaly detection.
The reporting system can automate the identification and organization of evidence. The decision to modify an important production website should follow the organization’s authorization and verification procedures.
That separation is what turns weekly reporting into an accountable operating process rather than an automated stream of speculative recommendations.
How do you turn weekly SEO findings into prioritized actions?
Weekly SEO findings should become actionable tasks only after their supporting measurements have been verified, plausible explanations have been investigated, and the proposed intervention has been connected to a defined business or technical objective. Each task should identify the affected pages, available evidence, responsible owner, priority, approval status, and acceptance criteria. An automatically detected performance change is not sufficient justification for modifying a website.
The most consequential weakness in conventional SEO reporting is often found between identifying a problem and deciding what to do about it. A dashboard may show that impressions declined, organic sessions fell, or a commercial landing page generated fewer inquiries. Yet, the report often ends with a broad recommendation to improve content, investigate rankings, or optimize the affected page. Such recommendations may sound reasonable, but they provide little operational direction when the underlying cause is unclear.
A governed reporting workflow should separate a verified observation from the diagnostic process that follows it. The first stage establishes what occurred within the reporting systems. The second examines why the condition may have occurred. The third determines whether additional investigation, remediation, or continued observation is justified. Only then should an approved task enter an implementation queue.
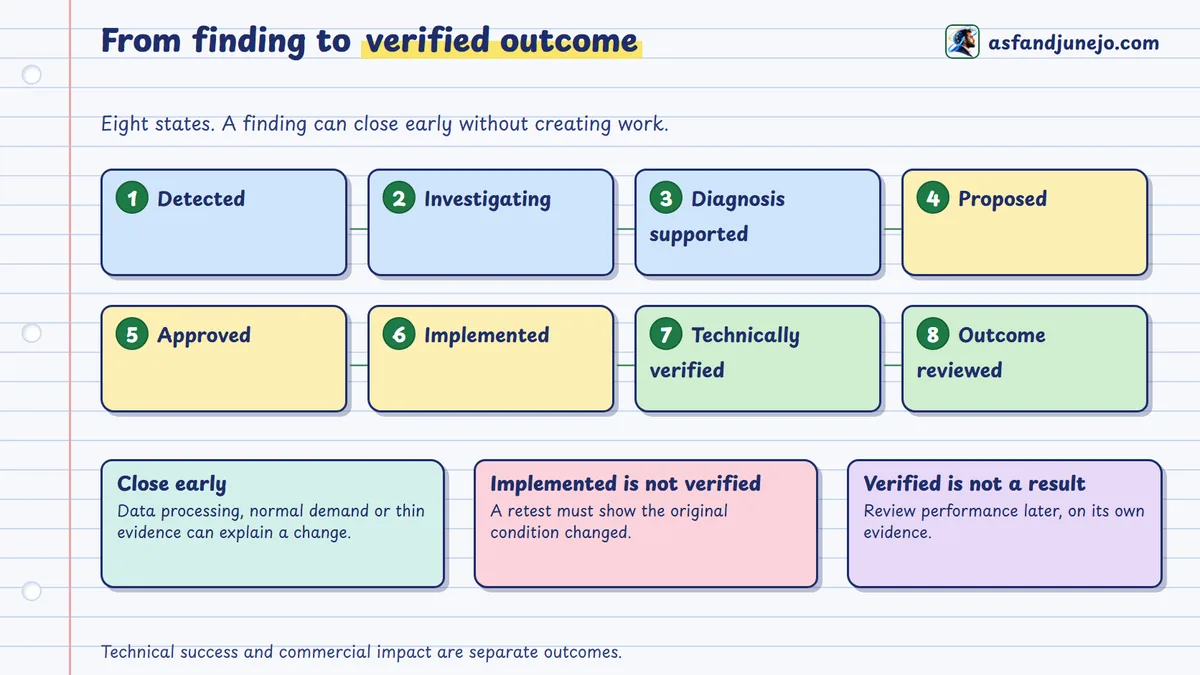
Distinguish an anomaly from a diagnosis
An anomaly is an observation, not a diagnosis; investigate causes before proposing a fix.
Consider an important service page whose Search Console clicks decline over two consecutive reporting periods. The automated system can identify movement, calculate absolute and relative changes, and determine whether the observation meets the organization's anomaly criteria.
Those calculations establish a performance change. They do not establish its cause.
The decline could reflect reduced impressions, lower click-through rate, a changing distribution of search queries, movement in comparable ranking positions, seasonality, or changes elsewhere in the search results. Several explanations may be plausible, and some can occur simultaneously.
A reliable investigation should examine the available evidence before recommending a content revision or technical intervention.
For example, if impressions and clicks decline together while CTR remains relatively stable, the analyst may investigate changes in search demand, page visibility, and indexing. If impressions remain stable but CTR decreases, the investigation may focus more heavily on ranking distributions, query intent, and search-result presentation.
Neither pattern independently establishes that the page's title or content needs to be rewritten.
Introduce a structured finding record
Every verified finding should receive a unique identifier that remains stable throughout the investigation and implementation process.
The record should preserve the evidence available when the issue was detected, rather than allowing later analysis to overwrite the original observation.
| Field | Required information |
|---|---|
| Finding ID | Unique identifier |
| Source | GA4, Search Console, or another approved system |
| Property | Exact reporting property |
| Reporting period | Current and comparison dates |
| Affected URLs | Relevant pages or page groups |
| Observation | Verified metric movement |
| Magnitude | Absolute and relative change |
| Source evidence | API request or report reference |
| Quality status | Validation result |
| Hypotheses | Possible explanations |
| Contradictory evidence | Observations challenging those explanations |
| Business relevance | Importance of affected content |
| Proposed action | Investigation or remediation |
| Owner | Responsible team or person |
| Approval state | Current authorization |
| Acceptance criteria | Testable completion requirements |
| Outcome review | Post-implementation evidence |
The same record should be used throughout the task lifecycle. This reduces the risk of losing the original context as a finding moves between SEO specialists, content teams, analysts, and developers.
Prioritize by evidence, impact, and urgency
Anomaly magnitude alone should not determine priority.
A small percentage decline on a major lead-generating page may warrant more attention than a much larger percentage movement on a page with minimal commercial importance.
Priority should incorporate the confidence of the diagnosis, affected content, potential business consequences, urgency, implementation risk, and expected verification effort.
A practical classification can be established as follows:
| Priority | Definition | Typical treatment |
|---|---|---|
| P0: Critical | Verified sitewide or business-critical failure requiring urgent intervention | Immediate escalation |
| P1: High | Confirmed material issue affecting important organic acquisition or reporting integrity | High-priority assignment |
| P2: Moderate | Meaningful issue or opportunity with sufficient evidence for scheduled work | Planned investigation or implementation |
| P3: Low | Limited-impact improvement without urgent consequences | Backlog review |
| Informational | Observation that does not justify intervention | Monitor or document |
These classifications are operational conventions, not official Google severity levels.
They should be adapted to the organization's business context and supported by a documented prioritization policy.
Separate technical implementation from performance outcomes
Suppose an investigation establishes that a commercially important page returns an unintended noindex directive.
The proposed task might be to remove the directive and verify the expected indexing configuration.
The technical acceptance criteria would concern the page's actual response, its indexing directives, and relevant Google inspection evidence.
A subsequent increase in organic impressions would be an outcome to evaluate separately. Removing the directive may be a justified correction, but the organization should not assume that all later traffic changes resulted from that intervention.
Google's (opens in a new tab)URL Inspection API (opens in a new tab) can provide information about the indexed version of a URL. Its API does not perform a live page inspection, so a production verification process may also require direct HTTP testing or the appropriate Search Console interface.
The reporting system should preserve that distinction.
Define the complete action lifecycle
Track each finding through eight states, from Detected to Outcome Reviewed, and let it close early when no action is needed.
A mature weekly action register should support the following states:
Detected → Investigating → Diagnosis Supported → Proposed → Approved → Implemented → Technically Verified → Outcome Reviewed
Not every finding must progress through every stage.
An investigation may be closed without remediation because data processing, normal demand fluctuations, or insufficient evidence caused the apparent anomaly.
The ability to close a finding without creating unnecessary work is an important measure of reporting quality.
What are five repeatable SEO investigation workflows?
Automated SEO reporting becomes useful when recurring performance patterns lead to standardized investigations with consistent evidence requirements. The following five workflows address declines in search visibility, click-through opportunities, GA4–Search Console discrepancies, weak landing-page business performance, and potential indexing issues. Each should generate a supported next step rather than an automatically approved website change.
Workflow 1: Investigate declining organic search clicks
Objective: Determine which pages, queries, countries, or devices account for a meaningful decline in reported Google Search clicks.
Begin by comparing aggregate Web Search clicks and impressions across the validated reporting periods.
Next, retrieve page-level results to identify the URLs contributing to the largest absolute movements. Query-level analysis can then provide additional context for important pages, subject to Search Console's privacy and row limitations.
The investigation should distinguish declining search exposure from declining click propensity.
| Observation | Possible explanation | Required verification |
|---|---|---|
| Clicks and impressions decline | Reduced exposure or demand | Query and page segmentation |
| Clicks decline, impressions remain stable | CTR or query-composition change | Position and SERP examination |
| One important page declines | Page-specific visibility or demand change | Comparable query and URL analysis |
| Most pages decline simultaneously | Broader demand, technical, or platform condition | Sitewide and external evidence |
| Only mobile declines | Device-specific issue or query mix | Mobile reporting and technical checks |
The workflow should calculate the contribution of important URLs to the overall change using compatible source definitions.
Where the available query data is incomplete, the report must disclose that limitation.
- Recommended output: A ranked list of affected pages, verified observations, competing explanations, and appropriate next investigations.
- Do not automatically recommend: Rewriting every page showing a decline.
Workflow 2: Identify potential search CTR opportunities
Objective: Find important search-result segments where click propensity deserves investigation.
A simple report might identify pages with substantial impressions and relatively low CTR.
However, that observation has limited diagnostic value without examining the queries, devices, countries, positions, and search-result contexts associated with those impressions.
An informational query may produce different user behavior from a commercial query. A result appearing below several prominent search features may attract fewer clicks than one occupying a more visually prominent position.
The workflow should therefore compare reasonably similar query and page segments rather than relying on a universal CTR benchmark.
A potential opportunity should include:
| Evidence | Purpose |
|---|---|
| Query or page | Identify the affected result |
| Impressions | Establish exposure scale |
| Clicks | Measure observed acquisition |
| CTR | Calculate click propensity |
| Average position | Provide ranking context |
| Search intent | Explain likely user expectations |
| SERP observations | Identify competing result presentation |
| Recommended investigation | Define an evidence-supported next step |
A title or description revision may eventually be appropriate if the existing presentation poorly represents the content or fails to address the relevant search intent.
However, Google may generate snippets from page content, and changes to a publisher's title or description do not guarantee a specific presentation in search results.
The automation should therefore recommend reviewing actual search-result evidence before producing a specific editorial intervention.
Workflow 3: Investigate Search Console and GA4 discrepancies
Objective: Determine whether a divergence between Google Search clicks and recorded Google organic sessions reflects expected measurement differences or an issue requiring correction.
Google explicitly explains that (opens in a new tab)Search Console clicks and GA4 sessions use different measurement systems (opens in a new tab).
Therefore, the workflow should begin with trend analysis rather than imposing an arbitrary equality requirement.
The diagnostic sequence should inspect property coverage, source and medium filters, date boundaries, GA4 collection, redirects, consent behavior, and URL mapping.
If the discrepancy is concentrated on particular pages, examine whether Search Console assigns metrics to canonical URLs while GA4 records alternative landing URLs.
If the discrepancy appears across the entire property, investigate whether the tracking implementation or acquisition classification changed.
The workflow should also examine known implementation releases during the affected period.
Recommended output: A reconciliation record identifying the verified measurement difference, plausible explanations, completed checks, unresolved conditions, and any justified tracking or technical task.
A mismatch must not automatically be labeled a GA4 tracking failure.
Workflow 4: Identify important organic landing pages with weak business response
Objective: Determine whether commercially relevant landing pages are attracting measurable organic visitors but not generating the expected interactions.
Begin by identifying pages receiving meaningful Google organic sessions.
Group pages by their intended purpose, such as service, product, informational, comparison, or research content.
Then examine relevant engagement and key-event behavior within those categories.
A service page may be expected to generate inquiries. An informational article may be designed primarily to answer an early-stage question and help users understand a topic.
Applying the same conversion-rate threshold to both can create misleading priorities.
The analysis should also verify whether the appropriate lead-generation events are implemented and working correctly.
A recorded form submission does not automatically establish a unique qualified lead. If commercial qualification is important, the investigation should incorporate an authorized CRM source.
Possible next steps include reviewing page relevance, user experience, call-to-action clarity, form functionality, tracking accuracy, and alignment with business intent.
The action should depend on which evidence supports the explanation.
Workflow 5: Investigate disappearing pages or suspected indexing problems
Objective: Determine whether a decline in reported search activity is associated with a technical indexing or delivery problem.
An important URL may stop appearing in expected reports for several reasons. It may have lost demand, become associated with another canonical URL, returned an error, been excluded from indexing, or simply failed to appear in a limited detailed report.
Therefore, the absence of a row in a Search Analytics response is not sufficient evidence of deindexation.
The investigation should examine the URL's direct HTTP behavior, robots directives, canonical signals, relevant Search Console index information, and known website changes.
Where authorized, the Search Console URL Inspection API can provide indexed-status evidence.
The investigation should also account for that API's quotas and its limitation to Google's indexed version.
Recommended output: A verified technical diagnosis where possible, or an explicitly inconclusive finding with defined next tests.
The workflow should never recommend changing canonical tags, indexing controls, or robots.txt policies solely because a URL experienced lower clicks.
Standardizing the five workflows
All five workflows return the same result structure so findings can be compared and tracked.
All five workflows should return a common result structure:
Observation → Evidence → Alternative explanations → Confidence → Next investigation or proposed action → Owner → Acceptance criteria
This structure allows an organization to automate repetitive analysis while preserving a consistent standard for decision-making.
How do you schedule weekly SEO reports, alerts and reviews?
Weekly SEO reporting should be scheduled based on verified data availability rather than on the fixed assumption that the immediately preceding calendar week is complete. Dashboard delivery can be automated through Google's reporting tools, while advanced pipelines can schedule API retrieval, quality checks, anomaly detection, and task creation. Routine performance reports should be distributed only after their required data-quality checks have passed.
Scheduling is often presented as the simplest part of reporting automation. In practice, the schedule determines whether the report operates on reliable information.
Search Console data is commonly delayed by approximately two to three days, and GA4 also requires time to process and aggregate events.
A report generated early Monday morning may therefore contain incomplete Search Console information for the preceding weekend.
If incomplete periods are compared with complete historical periods, the resulting dashboard can indicate a decline that disappears after the delayed data arrives.
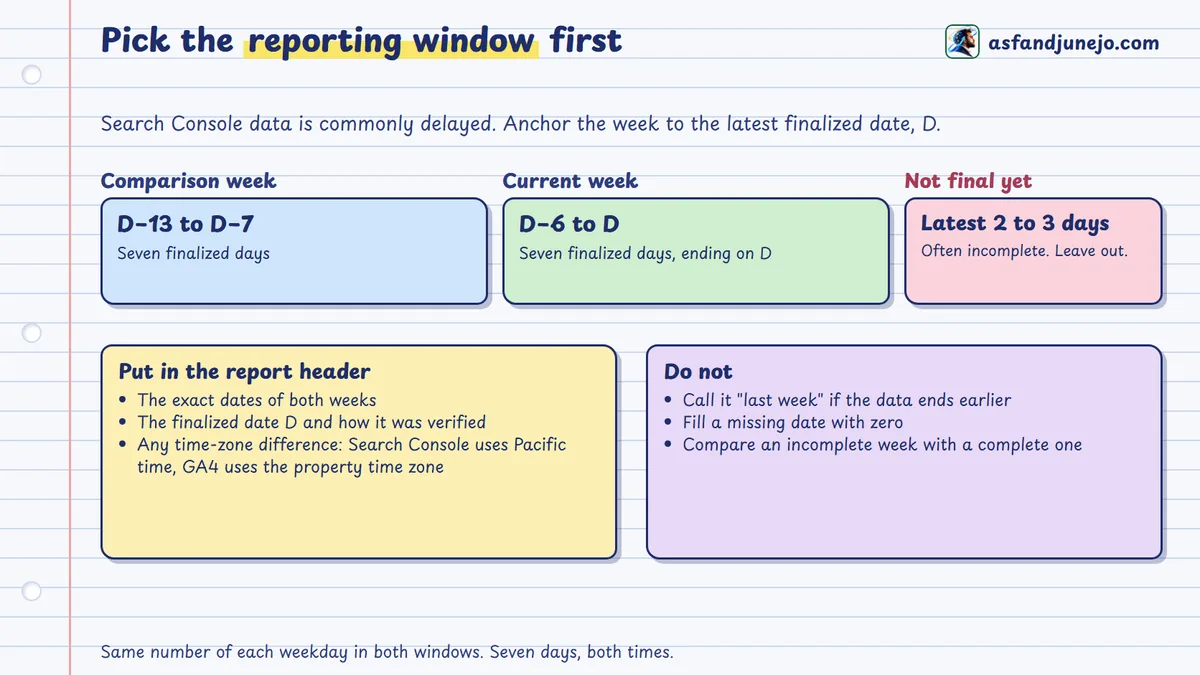
Choose the reporting period before choosing the delivery time
A reliable workflow should determine the latest finalized Search Console date available for the required reporting population.
The current reporting period should then cover seven consecutive finalized days.
The comparison period should cover the immediately preceding seven days.
The exact dates should appear in the report header.
A reporting system should not label a dataset "last week" if the reporting window actually ended several days before the most recent calendar Sunday.
It should state the actual dates and, where necessary, explain the delay.
Scheduling a Google reporting dashboard
Google's (opens in a new tab)Data Studio scheduled delivery feature (opens in a new tab) supports recurring PDF distribution.
A typical implementation involves opening the completed report, selecting Share → Schedule delivery, adding recipients, choosing the report pages, setting the delivery time, and selecting the repeat frequency.
The schedule can also preserve specific filter and date-control values.
However, scheduled PDF generation does not automatically inspect the source's finalized-data state or approve analytical findings.
A dashboard-only implementation should therefore include an explicit indication of data freshness and an established review procedure.
For workflows requiring strict gating, a separate validated pipeline may be more appropriate.
Advanced API-based scheduling
Split the pipeline into independent jobs, each with its own responsibility and failure behavior.
An advanced workflow can be divided into independent jobs:
| Job | Responsibility | Failure behavior |
|---|---|---|
| Data availability check | Determine usable reporting dates | Hold report if incomplete |
| GSC retrieval | Retrieve approved Search performance data | Log and retry within limits |
| GA4 retrieval | Retrieve defined acquisition and engagement data | Log and retry within limits |
| Validation | Check completeness, metadata, and transformations | Block unreliable results |
| Analysis | Calculate changes and detect candidates | Suppress unsupported claims |
| Evidence investigation | Produce structured hypotheses and diagnostic records | Mark unresolved findings |
| Review delivery | Send report and proposed tasks | Request human review |
| Action update | Record decisions and ownership | Preserve approval states |
| Retest | Verify completed interventions | Record verified or inconclusive outcome |
The jobs should have stable identifiers and support safe retries without duplicating reporting records or tasks.
For example, if a delivery job fails after the analysis has completed, retrying delivery should not create an entirely new set of findings.
The system should preserve the identity of the reporting run and recognize previously created tasks.
Quota management
Google's APIs apply quotas and request limits.
The Search Analytics API can become more expensive when queries use long date ranges or detailed dimensions. The GA4 Data API uses token-based reporting quotas and applies additional limits to relevant methods.
A production process should use bounded retries, avoid unnecessary repeated queries, and preserve validated historical data where appropriate.
Official references include (opens in a new tab)Search Console API usage limits (opens in a new tab) and (opens in a new tab)GA4 Data API quotas (opens in a new tab).
Failure notifications are part of the report
A reliable automated reporting system should notify its owner when source retrieval or quality validation fails.
The notification should explain the affected source, the failed check, the reporting dates, and the expected next investigation.
It should not substitute outdated numbers into the current report without disclosure.
A failed reporting run is an operational event that should be tracked, just as an SEO anomaly would be.
Weekly review and ownership
A reporting schedule becomes an operational workflow when an accountable person reviews important findings and makes explicit decisions.
A practical weekly review can address the highest-impact changes, unresolved investigations, approved implementation tasks, and verification results from earlier weeks.
The meeting or review process should focus on decisions rather than reading every dashboard metric aloud.
If no findings justify action, the outcome can simply be continued monitoring.
How do you use Claude or another AI assistant for evidence-led SEO reporting?
Claude and other AI assistants can support weekly SEO reporting by retrieving approved information, summarizing verified changes, identifying potential patterns, and drafting structured investigations. Their conclusions must remain constrained by the available evidence, and they should not receive unrestricted authority to modify websites or reporting properties. Human review remains necessary for consequential diagnoses and implementation decisions.
AI assistants are particularly useful when an analyst must examine several related data sources and explain the possible significance of observed changes.
However, generating a coherent explanation is not the same as proving that explanation.
An assistant may identify a real decline in Search Console clicks and then attribute the movement to a Google algorithm update without retrieving sufficient evidence.
The underlying metric can be correct while the interpretation is unsupported.
A governed workflow should prevent these different claim types from being merged.
Separate retrieval from interpretation
The first stage should retrieve authorized GA4 and Search Console measurements using approved tools.
Each response should identify the property, date range, metrics, dimensions, filters, and relevant limitations.
The second stage should calculate the required comparisons and verify the resulting values.
Only after these steps should the assistant begin investigating possible explanations.
This sequence reduces the risk that a plausible narrative will influence which evidence is subsequently selected.
Apply read-only permissions
Where Claude connects through an MCP server or another approved integration, its access should be limited to the reporting operations necessary for the task.
A conversational instruction to avoid changes is useful, but it is not a substitute for actual access restrictions.
The integration should not expose unnecessary write tools or broad authorization.
Similarly, sensitive source information should be shared only with AI services permitted under the organization's data-processing and confidentiality policies.
The implementation should distinguish between a local connector and the model infrastructure that processes retrieved information.
Require claim-level evidence
Make the assistant separate verified observations, calculations, hypotheses, contradictions, recommendations and open questions.
A useful AI-generated analysis should separate:
- Verified observations: Measurements directly supported by the retrieved data.
- Calculated findings: Values produced through reproducible formulas.
- Diagnostic hypotheses: Possible explanations that require further testing.
- Contradictory evidence: Observations that weaken a proposed explanation.
- Recommendations: Next steps supported by the available information.
- Unresolved questions: Conditions that cannot be established from the connected sources.
These categories should be displayed explicitly rather than embedded in an uninterrupted narrative that makes all statements appear equally certain.
Master prompt for weekly SEO analysis
Use one master prompt that fixes the data scope, validation, analysis, governance and output sections.
ROLE
Act as an evidence-led SEO reporting analyst.
OBJECTIVE
Analyze the approved Google Analytics 4 and
Google Search Console properties.
Produce a verified weekly performance report
and a prioritized investigation register.
ACCESS AND SECURITY
Use only approved read-only data sources.
Do not modify website content, analytics
settings, indexing controls, or permissions.
Do not transmit retrieved data to unrelated
tools or services.
REPORTING PERIOD
Determine the latest finalized reporting
date available for the required GSC scope.
Use:
- Current 7-day finalized period
- Previous comparable 7-day period
Identify all dates explicitly.
DATA VALIDATION
Verify:
- Correct property identifiers
- Reporting completeness
- GA4 and GSC metric definitions
- Search type and acquisition filters
- API data limitations
- URL mapping exceptions
- Relevant GA4 response metadata
If material checks fail, mark the report
BLOCKED or INCONCLUSIVE.
Do not manufacture missing values.
ANALYSIS
Evaluate:
1. GSC clicks and impressions
2. GSC CTR and average position
3. GA4 Google organic sessions
4. Engagement and approved key events
5. Important landing-page changes
6. Relevant query, country, and device segments
Use compatible aggregation methods.
Do not treat clicks and sessions as identical.
Do not attribute conversions directly to
Search Console queries without evidence.
INVESTIGATION
For each meaningful anomaly:
- State the verified observation
- Calculate absolute and relative change
- Identify affected pages or segments
- Compare historical context
- List possible explanations
- Examine contradictory evidence
- Identify missing evidence
- Assess business importance
TASK GOVERNANCE
Separate:
- Further investigations
- Supported remediation proposals
- Previously approved tasks
Do not approve or execute changes.
OUTPUT
A. Data quality verdict
B. Executive performance summary
C. Source-specific metric comparison
D. Verified anomalies
E. Diagnostic hypotheses
F. Contradictory evidence
G. Prioritized investigation register
H. Proposed actions requiring approval
I. Source and calculation ledger
J. Reporting limitations
For each material claim, preserve its
source request and calculation method.
The prompt is a reusable operating template, not proof of a completed integration or live reporting test.
Prevent unsupported recommendations
The reporting assistant should be allowed to say that the evidence is insufficient.
For example, a decline in clicks without a corresponding site inspection should not automatically lead to the conclusion that the page has been deindexed.
A session decline without source-validation checks should not automatically produce a tracking-repair instruction.
The correct next step may be to collect additional evidence.
Use AI for synthesis, not independent authorization
AI-generated findings can be routed into a draft task register.
The SEO reviewer should approve the diagnosis and proposed action before it becomes an implementation assignment.
A developer or content owner should then complete the task in accordance with normal authorization procedures.
The assistant can help prepare the retest criteria and summarize subsequent observations, but technical completion and business impact should still be independently verified.
How do you test manual reporting against governed automation?
The effectiveness of automated SEO reporting should be evaluated by comparing the accuracy, usefulness, and total operational cost of automated reports with a defined manual baseline. Faster report generation alone does not demonstrate better reporting. A valid comparison must include data validation, false-positive investigations, unsupported recommendations, human correction, and verification of the resulting tasks.
A controlled study can help determine whether an evidence-governed workflow improves the way an SEO team identifies and responds to important performance changes.
The proposed investigation should use authorized GA4 and Search Console data.
Its purpose is not to prove in advance that automation is superior, but to determine under which conditions the approach provides measurable value.
Research question
Can an evidence-governed automated weekly reporting workflow identify meaningful SEO investigations more efficiently than a manual process without increasing unsupported recommendations?
Study design
Select a website with sufficient historical reporting information and a documented manual reporting process.
An initial pilot could examine six consecutive weekly reporting periods.
For each period, the manual and automated methods should analyze the same underlying source data and equivalent reporting questions.
The methodology should define whether the manual analyst and automated system can access the same supplementary sources, such as crawl records or URL Inspection.
A comparison would be misleading if one method received substantially more evidence than the other without disclosure.
Define the evaluation criteria before testing
Define the evaluation criteria before you run the manual-versus-automated test.
| Evaluation measure | Operational definition |
|---|---|
| Preparation time | Time required to obtain and prepare source data |
| Validation time | Time spent checking completeness and calculations |
| Analysis time | Time required to produce findings |
| Review time | Human time spent validating results |
| Total reporting effort | Combined preparation, validation, analysis and review |
| Metric accuracy | Agreement with independently verified source results |
| Valid anomalies | Findings meeting predefined investigation criteria |
| False-positive alerts | Alerts rejected after independent evidence review |
| Unsupported diagnoses | Causal or technical claims lacking sufficient evidence |
| Accepted investigations | Findings approved for further examination |
| Accepted remediations | Supported interventions approved for execution |
| Retest completion | Approved tasks receiving documented verification |
The experiment should not evaluate only the number of findings produced.
An automated system that generates many unsupported alerts may increase operational workload rather than reduce it.
Establish an independent reference review
A separate review process should assess which findings were valid and which were unsupported.
The automated system's conclusions must not serve as the standard against which it is evaluated.
Ideally, the reviewer should examine source evidence without knowing which reporting method produced each finding.
Where blinding is impractical, the limitation should be disclosed.
The reviewer should distinguish actual data errors, weak analytical interpretations, incomplete investigations, and valid findings that simply did not justify immediate action.
Report the total time required
A common automation claim is that a report which previously required hours can now be generated in minutes.
That claim may describe the initial generation step while excluding data preparation, troubleshooting, evidence verification, and correction.
The experiment should calculate:
Total reporting effort = Preparation + Validation + Analysis + Human review + Corrections
Where appropriate, setup and maintenance effort should also be reported separately.
This prevents recurring time savings from being exaggerated by ignoring the cost of building and operating the automation.
Analyze false positives and missed problems
False-positive alerts waste time by triggering investigations that do not correspond to meaningful or well-supported issues.
Missed problems can also be consequential if the workflow fails to detect significant technical or commercial changes.
The study should record both categories wherever an independent reference set permits evaluation.
A proposed finding should not be considered successful merely because it was accepted into a task queue.
Its diagnostic quality and eventual verification matter.
Distinguish technical success from commercial impact
Suppose the automated workflow identifies a genuine redirect problem and the development team corrects it.
The technical success can be verified by confirming that the affected URLs behave as intended.
An increase in organic traffic after the correction is a separate observation.
Without an adequate causal design, the experiment should not assign all subsequent traffic growth to that fix.
Preserve negative and inconclusive results
The final research report should include findings even when the automated approach performs no better than the manual process.
An inconclusive result can be valuable if it identifies limitations in data quality, anomaly precision, analyst review, or implementation complexity.
Publishing only successful automation examples would weaken the credibility of the research.
Required experiment outputs
The study must document its reporting periods, source properties, sample design, manual and automated procedures, validation rules, scoring method, observed results, alternative explanations, and limitations.
No time-saving percentages, accuracy improvements, or completed interventions should be claimed before the experiment has been conducted.
How do you build a weekly SEO action dashboard?
A weekly SEO action dashboard should combine a concise performance summary with data-quality status, high-priority investigations, accountable tasks, and verification outcomes. Its purpose is to show decision-makers what changed, what the evidence supports, and what requires attention next. Metrics from GA4 and Search Console should remain identifiable by source rather than being combined into incompatible totals.
The dashboard should avoid cramming every available SEO metric onto one crowded screen.
A useful structure moves from performance context to investigation and then to operational decisions.
Dashboard layer 1: Reporting integrity
The top of the dashboard shows reporting integrity first: which sources, which dates and whether the data passed its gates.
The top of the dashboard should identify:
- Website and reporting properties.
- Current and comparison periods.
- Source-data freshness.
- Validation outcome.
- Last successful reporting run.
- Known data-quality warnings.
A source-quality warning should remain visible even when the performance charts appear normal.
This prevents stakeholders from treating incomplete data as fully verified.
Dashboard layer 2: Core performance summary
The executive summary should show a small number of decision-relevant metrics.
| KPI | Current period | Comparison period | Change | Status |
|---|---|---|---|---|
| GSC clicks | Source value | Source value | Calculated | Pending |
| GSC impressions | Source value | Source value | Calculated | Pending |
| GSC CTR | Source value | Source value | Calculated | Pending |
| GSC average position | Source value | Source value | Calculated | Pending |
| GA4 Google organic sessions | Source value | Source value | Calculated | Pending |
| GA4 engagement rate | Source value | Source value | Calculated | Pending |
| Defined key events | Source value | Source value | Calculated | Pending |
This is a reporting template. No performance numbers have been supplied or implied.
Each calculated change must use the appropriate metric formula and reporting grain.
Dashboard layer 3: High-priority investigations
This section should contain the most consequential verified anomalies.
For each finding, display the affected URL or segment, observed change, business importance, evidence confidence, and recommended investigation.
A finding with insufficient evidence should remain marked as an investigation rather than a remediation task.
The dashboard should allow reviewers to distinguish a source-data problem from an SEO performance problem.
Dashboard layer 4: Weekly action register
The action register is where reporting becomes accountable.
| Task field | Example of required value |
|---|---|
| Task ID | Stable tracking identifier |
| Related finding | Evidence record reference |
| Task type | Investigation, remediation, or monitoring |
| Priority | Approved severity |
| Owner | Responsible individual or team |
| Due date | Agreed deadline |
| Approval | Proposed, approved, or rejected |
| Completion | Current implementation status |
| Acceptance criteria | Explicit technical or analytical test |
| Retest | Verification result |
| Outcome review | Separate downstream analysis |
An action should not be marked verified simply because someone has changed its task status to completed.
Verification requires the appropriate evidence.
Dashboard layer 5: Historical follow-through
A mature dashboard should show whether previous investigations were resolved, whether approved fixes were technically verified, and whether post-implementation observations have been reviewed.
This prevents reporting from becoming a continuous stream of new recommendations without accountability for earlier decisions.
Useful operational measures include open high-priority investigations, overdue approved tasks, completed but unverified interventions, and tasks whose outcomes have been reviewed.
These operational KPIs should remain separate from organic performance metrics.
Executive interpretation
The dashboard should conclude with a brief, evidence-grounded decision summary.
The narrative should identify the most important changes, any serious data limitations, decisions requiring approval, and progress on existing tasks.
It should not manufacture a diagnosis to make the report appear more decisive.
When the evidence does not justify a change, continued monitoring is a valid recommendation.
What are the common automated SEO reporting errors and failure modes?
Automated SEO reporting can produce misleading results when incomplete data, incompatible metrics, incorrect joins, or unsupported diagnoses are repeatedly processed without validation. Many failures are not caused by the reporting platform itself but by assumptions embedded in the workflow. Detecting these problems before distribution is essential for maintaining analytical accuracy and stakeholder confidence.
Error 1: Using incomplete recent data
A report may compare an incomplete recent Search Console period with a complete historical period and incorrectly identify a traffic decline.
Required control: Verify finalized reporting dates before selecting comparison windows.
Error 2: Treating clicks and sessions as equivalent
Search Console clicks and GA4 sessions are measured differently.
Required control: Preserve source-specific definitions and investigate trend discrepancies without imposing numerical equality.
Error 3: Summing distinct users across dates
Daily user counts may include the same person on several days.
Required control: Retrieve or calculate period-level distinct-user metrics through an appropriate method.
Error 4: Averaging CTR or position incorrectly
An unweighted average of daily CTR percentages can be misleading. Average position also requires careful treatment of Google's reporting definition.
Required control: Apply the correct aggregation logic to compatible source measurements.
Error 5: Assuming query exports are complete
Search Console excludes certain queries and limits detailed API reporting.
Required control: Preserve the distinction between aggregate totals and available detailed query rows.
Error 6: Joining URLs without a reliable mapping
A GA4 landing-page path can resemble a Search Console URL while representing a different hostname, parameter variant, or canonical relationship.
Required control: Retain raw identifiers and validate transformations before page-level comparisons.
Error 7: Ignoring GA4 sampling and thresholding
Some GA4 reports may use sampling or suppress detailed information.
Required control: Inspect relevant response metadata and qualify affected analyses.
Error 8: Using unsupported anomaly thresholds
A universal percentage decline does not account for baseline volume or normal variation.
Required control: Combine relative movement with absolute impact, historical context, and business importance.
Error 9: Treating every anomaly as a root cause
A decline in performance does not, by itself, establish an indexing, content, or algorithm problem.
Required control: Require a diagnostic investigation and contradictory-evidence review.
Error 10: Allowing AI to invent explanations
An assistant may generate a plausible narrative without accessing the evidence required to establish it.
Required control: Require source references, explicit hypotheses, and uncertainty labels.
Error 11: Automatically approving implementation
A reporting integration should not have authority to make consequential website changes simply because it identified a problem.
Required control: Separate analytical permissions, task approval, and implementation authority.
Error 12: Ignoring failed automation runs
An API or dashboard failure may result in missing reporting, stale values, or incomplete charts.
Required control: Monitor execution status, notify responsible owners, and block normal distribution when required checks fail.
Error 13: Misrepresenting task completion as verified success
A task-management system may show that work is completed without confirming that the technical condition has changed as intended.
Required control: Use independent acceptance tests and preserve retest evidence.
Error 14: Claiming causal SEO improvements without sufficient evidence
Traffic growth after an intervention does not establish that the intervention produced the growth.
Required control: Separate technical verification, observed performance changes, and causal claims.
Error 15: Ignoring operational maintenance
API fields, authentication methods, reporting interfaces, and website configurations can change.
Required control: Maintain versioned data contracts, monitoring, access reviews, and a dated methodology record.
These failures should be treated as design requirements for the automation system rather than merely as warnings added to the end of a report.
What templates and checklist help automate weekly SEO reporting?
A reusable automated SEO reporting toolkit should provide the data contracts, validation rules, investigation templates, and task records necessary to reproduce the methodology. It should not merely offer a decorative dashboard. The resources must help analysts preserve source definitions, identify unreliable reporting, document findings, approve actions, and verify results.
The recommended companion package should contain the following resources.
Weekly SEO reporting workbook
An editable workbook should contain dedicated sections for reporting configuration, Search Console measurements, GA4 measurements, URL reconciliation, data-quality checks, anomaly detection, findings, tasks, and executive reporting.
Formulas should preserve the distinction between missing data and measured zero values.
The dashboard should not display successful verification or calculated performance results before genuine source data has been entered.
GA4 and Search Console data contract
A source contract should define the expected properties, metrics, dimensions, filters, aggregation grain, reporting period, and known limitations for each dataset.
This document should serve as the reference for reviewing changes to the reporting pipeline.
URL normalization template
The mapping template should retain both the original URL values and approved normalized identities.
Ambiguous mappings should be flagged for review rather than resolved through unverified assumptions.
Weekly data-quality checklist
A pre-delivery checklist should verify the source properties, reporting dates, completeness, calculation integrity, sampling and thresholding warnings, and reporting eligibility.
The checklist should allow results to be marked Pass, Warning, Block, Not Tested, or Inconclusive.
SEO anomaly rulebook
The rulebook should document each anomaly condition, required baseline, business-impact criteria, false-positive controls, and investigative requirements.
Thresholds should be configurable and justified by the site's reporting history.
Findings and action register
The register should link every proposed task to its underlying evidence, owner, approval decision, implementation status, and acceptance criteria.
A task should not be marked technically verified without the required retest evidence.
AI-assisted analysis prompt library
The prompt library should contain reusable instructions for traffic-decline investigations, CTR reviews, page-level anomalies, GA4–GSC reconciliation, business-event analysis, and weekly executive reporting.
Every prompt should require source verification and distinguish observations from hypotheses.
Implementation and maintenance guide
The final package should explain how to connect the selected reporting sources, run the validation process, schedule approved reporting, handle failures, and maintain the source definitions.
The guide should avoid embedding credentials or confidential property data.
Final pre-delivery checklist
The report should be distributed only as a verified weekly performance review once the applicable requirements are met.
| Verification | Required status |
|---|---|
| Correct GA4 property | Pass |
| Correct Search Console property | Pass |
| Finalized reporting dates | Pass |
| Required API queries completed | Pass |
| Reporting grain documented | Pass |
| Source filters verified | Pass |
| Calculations validated | Pass |
| URL mapping reviewed | Pass or disclosed limitation |
| Important metadata warnings handled | Pass or disclosed limitation |
| Material anomalies independently assessed | Pass |
| Proposed actions separated from approved actions | Pass |
| Executive summary consistent with evidence | Pass |
An unresolved material failure should prevent the system from issuing an ordinary performance verdict.
Resources should use blank or clearly identified demonstration records and must not present hypothetical data as real website performance.
Where can you get the free weekly SEO reporting kit?
Join Search Signals with your email and three files unlock on this page straight away: the complete reporting kit (ZIP), the weekly reporting workbook (Excel) and a printable QA checklist (PDF).
The workbook has 13 tabs: start here, data contract, Search Console and GA4 weekly inputs, a weekly comparison, URL mapping, a data QA release gate, anomaly review, evidence ledger, action register, KPI dictionary, a dashboard and an executive brief. The kit also holds six blank CSV templates, a setup guide, an anomaly rulebook, a Claude prompt library and a methodology. It is an editable framework: it does not connect to your properties, and it contains no credentials and no invented performance numbers.
- Weekly SEO Reporting Kit (ZIP)Workbook, QA checklist, CSV templates and guides, branded PDFs plus editable files
- Weekly SEO Reporting and Actions WorkbookExcel workbook, 13 tabs
- SEO reporting QA checklistPDF, printable preflight and approval checks
Frequently asked questions about automated SEO reporting
What is automated SEO reporting?
Automated SEO reporting is the recurring collection, processing, validation, and presentation of search performance information using connected platforms or APIs. A more advanced workflow also detects meaningful changes, prepares evidence-backed investigations, and maintains a record of approved tasks and outcomes. Automation does not eliminate the need to verify measurements or consequential recommendations.
Can I combine Google Analytics 4 and Search Console into a single report?
Yes. Google's Data Studio supports connectors for both platforms, and their official APIs can support a custom reporting pipeline. The resulting report can display Search Console visibility data alongside GA4 acquisition and engagement information. However, clicks and sessions are distinct metrics and should not be forced to match.
How do I automate weekly Search Console reports?
A practical approach is to connect Search Console to a reporting dashboard and schedule delivery. For more control, use the Search Analytics API with explicit reporting dates, dimensions, filters, pagination, and source validation. The process should determine which dates are finalized before generating performance comparisons.
Can Looker Studio automatically email weekly SEO reports?
Google's Data Studio supports scheduled report delivery, including PDF attachments. The report can be distributed on an approved recurring schedule, subject to the product's permissions and limits. Scheduled delivery does not automatically establish that the source data is finalized or that AI-generated recommendations have been verified.
Why do my GA4 and Search Console numbers differ?
Search Console records qualifying Google Search interactions, while GA4 records website or application activity through its collection and attribution systems. Differences may arise from measurement definitions, tracking implementation, privacy controls, time zones, canonical URLs, redirects, and reporting scope. The totals are not expected to match exactly.
Can AI automatically explain organic traffic drops?
AI can identify measured declines, analyze affected segments, and propose explanations using approved source data. However, the available metrics may not establish the underlying cause. A reliable workflow should separate verified observations from hypotheses and request additional evidence before recommending consequential changes.
What should a weekly SEO report include?
A focused weekly report should include validated Search Console clicks, impressions, CTR, and average position; appropriately filtered GA4 organic sessions and engagement; important landing-page changes; relevant key events; data-quality status; and prioritized investigations. An advanced report should also track approved tasks, technical verification, and post-implementation outcomes.
What is an SEO reporting anomaly?
An anomaly is an observed performance movement that differs sufficiently from an appropriate baseline to justify investigation. Its significance depends on absolute impact, relative movement, expected variation, business importance, and source-data reliability. An anomaly is not necessarily a technical problem or an established cause.
Can automated SEO reporting create tasks for developers?
Yes. An automated workflow can generate draft tasks containing findings, supporting evidence, affected URLs, proposed checks, priorities, and acceptance criteria. However, important changes should pass through a defined approval process. Task creation should not be confused with authorization to modify the website.
How can I measure whether an SEO task worked?
First, verify that the approved technical or content change was implemented correctly. Then examine subsequent performance over an appropriate period. These are separate assessments. A completed intervention may be technically successful without producing an immediate measurable increase in traffic, and subsequent growth should not automatically be attributed to that intervention.
Is a custom API reporting pipeline better than a dashboard?
A dashboard is often sufficient for recurring visualization and scheduled stakeholder reporting. An API-based pipeline is more appropriate when an organization requires historical storage, formal data-quality checks, anomaly detection, integration with task systems, and reproducible evidence records. The preferred approach depends on operational needs, technical capacity, and governance requirements.
How often should automated SEO reports run?
Weekly reporting is useful for identifying changes and maintaining operational accountability, but the underlying data should be collected and analyzed according to its availability and processing limitations. Some sources may support more frequent monitoring, while business outcomes may require monthly or longer reporting windows. The schedule should be chosen for decision quality rather than reporting frequency alone.
Final analysis: automate collection, govern decisions, verify outcomes
Automated SEO reporting is most valuable when it improves the reliability and usefulness of decisions made based on search performance data. Collecting Google Analytics 4 and Search Console metrics on a recurring schedule can reduce repetitive work. Still, the process only becomes dependable when the information is validated, interpreted in line with its source definitions, and connected to an accountable investigation and approval workflow.
Search Console describes how a website performs within Google Search. GA4 records measurable activity after users interact with the website. These datasets provide complementary perspectives, but they do not share identical measurement units, processing rules, or attribution systems. Their differences must be preserved rather than hidden inside a unified dashboard.
A meaningful weekly report should establish what changed, assess the reliability of the observation, identify which pages or segments are affected, and investigate possible explanations before recommending an intervention. Some findings will justify technical corrections or content improvements. Others will require further evidence, continued monitoring, or no action.
The introduction of AI-assisted analysis makes this separation even more important. An assistant can retrieve data, perform comparisons, summarize trends, and prepare structured findings, but its ability to generate plausible explanations does not mean those explanations are correct. Source verification, competing hypotheses, and human approval remain essential safeguards.
A governed reporting process also extends beyond the initial recommendation. Approved work should be assigned to an accountable owner, implemented against explicit requirements, and independently retested. Subsequent performance changes should then be assessed with appropriate caution rather than automatically credited to the completed task.
The resulting system creates a durable relationship between measurement and execution. Historical reports become evidence records. Anomalies become structured investigations. Supported diagnoses become proposed interventions. Approved tasks become verifiable work, and completed interventions become opportunities for further learning.
For SEO teams, the objective should not be to produce more reports or more recommendations. It should be to improve the consistency with which important problems are recognized, evaluated, resolved, and reviewed.
Automate collection. Validate the data. Investigate meaningful changes. Approve actions deliberately. Verify implementation before claiming success.
That is how automated SEO reporting moves from recurring dashboard production to an evidence-led operating system for organic search performance.
Sources and method
The methods in this guide rest on the primary Google documentation below; the examples, prompt and experiment design are templates, not results.
The following primary documentation supports the methodology and technical recommendations in this article:
- Google Search Central: Using Search Console and Google Analytics Data for SEO (opens in a new tab). Metric reconciliation and combined reporting.
- Google Search Console: Search Analytics API (opens in a new tab): reporting dimensions, aggregation, finalized data, and API limitations.
- Google Search Console: Getting Your Performance Data (opens in a new tab). Pagination, row limits, reporting dates, and source completeness.
- Google Search Console: URL Inspection API (opens in a new tab). Indexed URL information and limitations.
- Google Search Console API Usage Limits (opens in a new tab). Request quotas and load considerations.
- Google Analytics: Reporting Data Expectations (opens in a new tab). Sampling, aggregation, thresholding, and reporting discrepancies.
- Google Analytics Data API Quotas (opens in a new tab). API resource constraints.
- Google Cloud: Schedule Automatic Report Delivery (opens in a new tab). Scheduled reports and distribution.
- Google Cloud: Connect to Search Console (opens in a new tab): Search Console connector behavior and aggregation.
Method The practical workflows, AI analysis prompt, and comparative experiment are methodologies intended for implementation and evaluation. No website-specific anomaly, operational time saving, reporting accuracy improvement, or remediation outcome has been presented as a completed empirical finding.